![]() Clay Webster
Clay Webster
FXStreet
UnitedHealth Group (UNH) stock, the largest holding in the Dow Jones Industrial Average (DJIA), sank 9% on Tuesday after the US’s largest health insurer reported costs in the third quarter exceeding prior guidance.
The medical care ratio, which compares insured costs compared to paid premiums, rose to 85.2% for the quarter ending in September. This compares noticeably with the quarter a year ago in which UnitedHealth saw a medical care ratio of 82.3%. Wall Street had expected a ratio of 84.4% in Q3.
The Dow Jones index slipped by half a percentage point on the news and was helped lower by another earnings report from Johnson & Johnson (JNJ). Earnings from Dow member Goldman Sachs (GS), however, helped the Wall Street bank rise 3%. The DJIA reached a fresh all-time high on Monday.
Despite the negative news on rising healthcare costs, UnitedHealth’s top and bottom lines for Q3 were quite impressive. The Minnesota-based insurer, which also has a managed care arm, reported an adjusted earnings per share (EPS) beat of 1.7%. Revenue in the quarter also beat the average Wall Street projection by 1.5%.
UnitedHealth earned $7.15 in adjusted EPS on revenue of $100.8 billion. This amounts to a 9% YoY rise in both adjusted EPS and revenue.
The UNH stock performance is affected by management’s full-year 2024 outlook of $15.50 to $15.75 per share in net income, which reflects charges to its South American operations and an expensive cyberattack that affected its Change Healthcare unit. That latter unit accounts for at least $0.75 per share in costs.
One good sign for shareholders is that the operating cost ratio fell from 15% one year ago to 13.2% in the quarter.
The UnitedHealthcare insurance unit saw revenues climb 7.2% YoY, while its healthcare services unit, Optum, saw a gain of 12.6% YoY.
Management lowered its full-year adjusted EPS outlook to between $27.50 and $27.75, down from an earlier top range of $28.00. Its 2025 guidance, however, really shocked its audience. Management just gave the round number of $30.00 for adjusted EPS in 2025. Bloomberg’s data suggests that analysts expected something closer to $31.16.
UNH stock has broken through its 100-day Simple Moving Average (SMA) on Tuesday. This is a significant happening. It means that the market will now look to the 200-day SMA near $525 as the nearest support. That level comports with a range high from May in its vicinity.
Longer-term support between $465 and $480 that held up most of the time in the first half of the year also comes into view. The lowest price of the year at $436.38 from April 12 can probably be disregarded. Healthcare premiums can be adjusted, and the overall business is extremely healthy in terms of turnover.
The market will forget about this earnings report once UNH stock overcomes the 50-day SMA, which is currently near $583.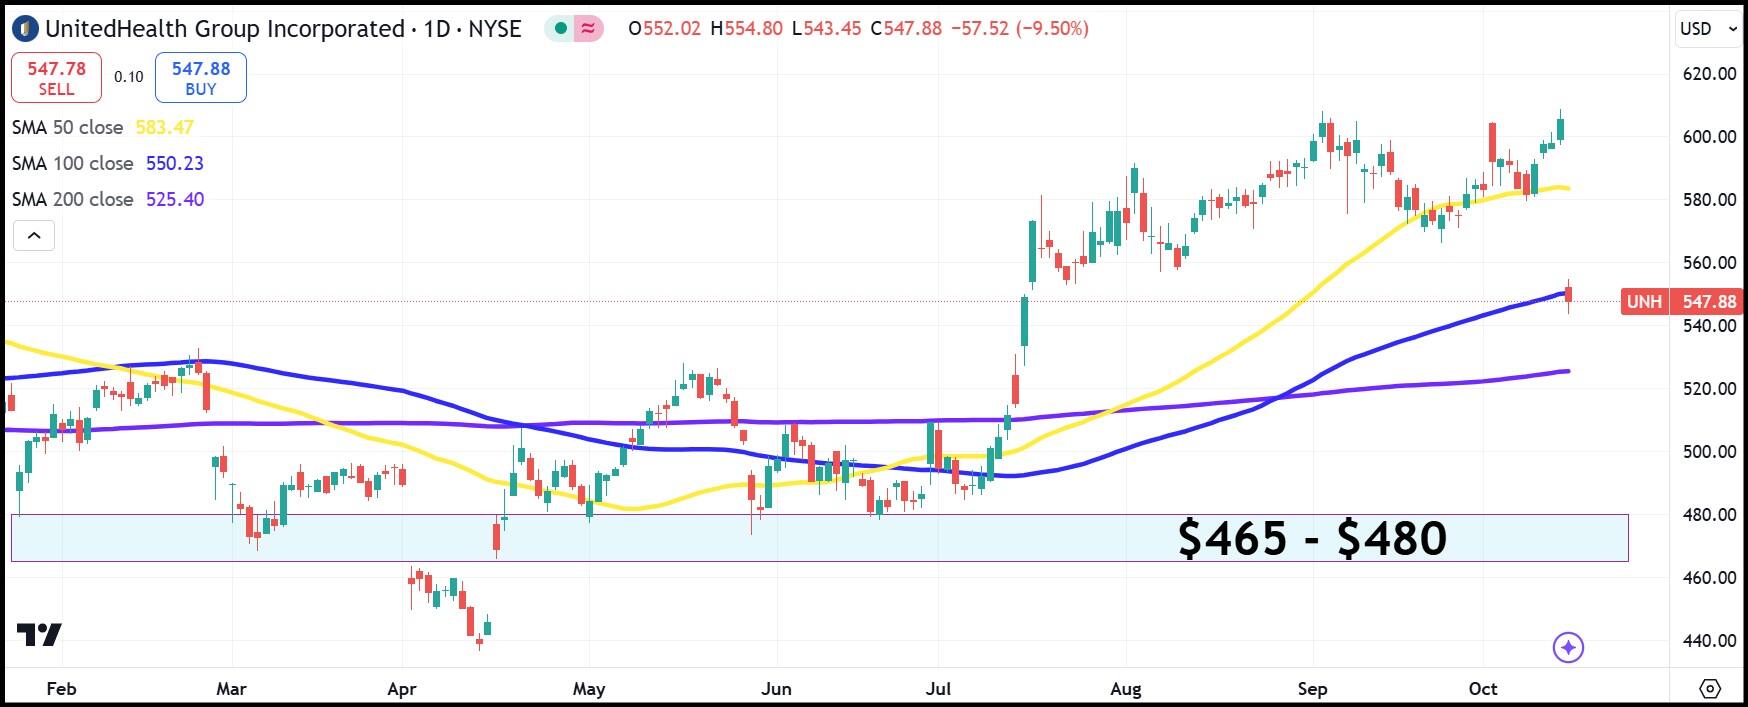
UNH daily stock chart
Information on these pages contains forward-looking statements that involve risks and uncertainties. Markets and instruments profiled on this page are for informational purposes only and should not in any way come across as a recommendation to buy or sell in these assets. You should do your own thorough research before making any investment decisions. FXStreet does not in any way guarantee that this information is free from mistakes, errors, or material misstatements. It also does not guarantee that this information is of a timely nature. Investing in Open Markets involves a great deal of risk, including the loss of all or a portion of your investment, as well as emotional distress. All risks, losses and costs associated with investing, including total loss of principal, are your responsibility. The views and opinions expressed in this article are those of the authors and do not necessarily reflect the official policy or position of FXStreet nor its advertisers. The author will not be held responsible for information that is found at the end of links posted on this page.
If not otherwise explicitly mentioned in the body of the article, at the time of writing, the author has no position in any stock mentioned in this article and no business relationship with any company mentioned. The author has not received compensation for writing this article, other than from FXStreet.
FXStreet and the author do not provide personalized recommendations. The author makes no representations as to the accuracy, completeness, or suitability of this information. FXStreet and the author will not be liable for any errors, omissions or any losses, injuries or damages arising from this information and its display or use. Errors and omissions excepted.
The author and FXStreet are not registered investment advisors and nothing in this article is intended to be investment advice.
AUD/USD continues to draw support from Thursday's upbeat Australian jobs report, which dashed hopes for an RBA rate cut this year. This, along with a positive risk tone and the optimism over China's stimulus, underpin the Aussie. That said, a bullish USD acts as a headwind ahead of the Chinese macro data dump.
The Japanese Yen struggles to capitalize on its modest intraday uptick against the USD. The uncertainty over the BoJ’s rate-hike plan and a positive risk tone undermines the JPY. Bets for smaller Fed rate cuts keep the USD elevated and also lend support to USD/JPY.
Gold price stands near a record high amid Middle East tensions and the expected rate cuts by major central banks, including the Fed. Furthermore, the uncertainty around the US Presidential election benefits the safe-haven XAU/USD.
Solana (SOL) hovers around the $150 level on Thursday. Recent gains in the native token of the Solana blockchain are likely catalyzed by rising investor and developer interest.
Despite worries about the financial health of the consumer and potential weakening in the labor market, U.S. retailers had a solid month in September. Control group sales rose more than twice the expected amount, pointing to stronger Q3 consumer spending.
VERIFIED Low spreads are crucial for reducing trading costs. Explore top Forex brokers offering competitive spreads and high leverage. Compare options for EUR/USD, GBP/USD, USD/JPY, and Gold.
Note: All information on this page is subject to change. The use of this website constitutes acceptance of our user agreement. Please read our privacy policy and legal disclaimer.
Trading foreign exchange on margin carries a high level of risk and may not be suitable for all investors. The high degree of leverage can work against you as well as for you. Before deciding to trade foreign exchange you should carefully consider your investment objectives, level of experience and risk appetite. The possibility exists that you could sustain a loss of some or all of your initial investment and therefore you should not invest money that you cannot afford to lose. You should be aware of all the risks associated with foreign exchange trading and seek advice from an independent financial advisor if you have any doubts.
Opinions expressed at FXStreet are those of the individual authors and do not necessarily represent the opinion of FXStreet or its management. FXStreet has not verified the accuracy or basis-in-fact of any claim or statement made by any independent author: errors and omissions may occur. Any opinions, news, research, analyses, prices or other information contained on this website, by FXStreet, its employees, clients or contributors, is provided as general market commentary and does not constitute investment advice. FXStreet will not accept liability for any loss or damage, including without limitation to, any loss of profit, which may arise directly or indirectly from use of or reliance on such information.